Its Almost Q4. Do You Know Where Your Revenue Is?
Share on 


Sep 26, 2024 by Sean LuceDon't think for a minute that forecasting/projections in not an art. Some managers spend their entire careers (and some have short ones) trying to correctly project their revenue - not only today, but also over a three-month period several months from now, such as the fourth quarter that is starting next week and looking into 2025 through a lens of some uncertainty.
Accurately projecting your revenue is more than running a bunch of numbers and figuring where you will end each week as a percentage of your monthly or annual goal. It's about being proactive, instead of reactive. If you can catch your pacing ahead of the curve and realize you are pacing behind 10 percent points, could you come up with specific strategies to make up the difference? In contrast, if you were blowing way over your pacing numbers one month out, would you drive rate? If your success strategy is derived only from knowing where you are and figuring out where you need to go, this is where accurately projecting revenue weekly comes in.
THREE-STEP PROJECTION PROCESS
The three-step process starts with your sales reps. Research has shown that, in most cases, daily call reports (DCRs) are specious and ineffective - especially when the sales manager does not actively scrutinize the call report and gives no feedback to the rep. It then becomes strictly a legislative process of paperwork
and an exercise in futility. Weekly planners or itineraries are much more proactive. There isn't much you can do after the sales rep has lost the order, but there is a heck of a lot you can do before they make the call (i.e., handle objections, role-play critical areas of the call with the sales reps etc.).
The weekly work plan Left Image is a tool for you as a manager to cover with your sales reps in your one-on-one weekly meeting. This planner can help you spot areas where the rep needs help, and it lets you know where he or she is going for the week, how many "quality" calls they are making, as well as their call mix. The weekly planner shown here is from Horizon Broadcasting Group (note that calls start at 9 a.m., not 11 a.m.).
Keep in mind that what we are looking for is not necessarily the "professional" visiting calls, but those of real substance. At the right side of each day's record, you will see three boxes, where your weekly forecasting comes into play. One box is the "objective" - it defines the rep's purpose of the call - "closing" or "3-month closing proposal" etc. If this were a closing call where real dollars were being presented (as opposed to trade), the sales rep would fill the "$$ pending" box with the actual dollars to be presented (like $10,000).
The third box is "% to close," which summarizes the most important information the sales rep can give you: the chances of closing that business that day. It will fluctuate anywhere from 10 percent to 100 percent. We want to focus on the 80-percent-or-better business that is defined as "a lock," "in the door," or whatever else you call it. In other words, the sales rep has an 80-percent-or-better chance of bringing in the order that week.
The planner's column "Total Business to be written this week for..." has three boxes in which you put the current three months. If we are in August, it would be August, September and October. Only those dollars listed as "80 percent or better" go into those boxes, to be tallied as actual pending business for the week. If the rep is projecting an annual, for example, you would separate the dollars that "annual" represents in those three months and then include the rest in the bottom box that says, "Total written this week" not visible/partial image. That is for all business 80 percent or better that falls in and out of the threemonth window.
PROJECTING WEEK-BY-WEEK
What do we do with those figures - and how does that help you project your revenue? The next spreadsheet, which goes hand-in-hand with the planner, is the "Weekly Revenue Projections" WRP worksheet Image below.
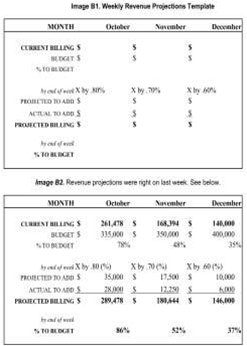
Here's what you do: Add all your sales reps? "total business" boxes from the "weekly planners" and transpose the figures correlating to the months on the WRP. These two images show a blank worksheet B1 and an example B2, in which the sales manager filled the blanks with the sales reps- figures and then calculated where they would be by end of week toward their actual station budget.
Start by inserting actual billing figures going into the week - what your budget is and what percentage of that figure represents your budget. Notice that across each month is a percentage number, which is used to calculate how much you are going to factor down the reps' actual projected dollars for that week. So, in the actual box (B2: in October), the sales manager enters his or her total projected dollars to add in October and then factors that by 80 percent, to give an accurate figure for the adds that week in that month. One month out is factored down by 70 percent, while two months out is factored down by 60 percent (this takes in the law of diminishing return, which says that the farther out, the harder it is to accurately project). Add the bottom figures to give the percentage you will have towards your actual budget by end of week.
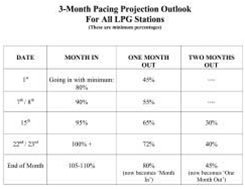
The third and last part shows where you should be and what tactics you can use to help you achieve your budget by knowing how you're pacing. It's called the "3-Month Pacing Projection Outlook" Image Above.
This spreadsheet simply tells you that you have arrived at 86 percent of your budget. The projected revenue from your sales reps would put you, by the 7th of October, pacing at 4 percent behind budget. To see your pacing for the next three months based on real figures that your sales reps think they can add for the week, line up the figures from the bottom "by end of week % to budget" and compare to the "3PPO" spreadsheet.
THERE ARE TWO THINGS TO NOTE AS YOU DO
THIS PROCESS:
- Understand that during the first three to four weeks that you do this, you will pick up certain trends from
your sales reps. Some might be blowing a lot of smoke at you and they can't project, which means you will have to help them define what should go into the boxes. Others will be under-projecting or "sandbagging," which in effect can throw your inventory management off considerably - and that will affect your rates (which in effect can reduce your potential revenue). Therefore, make sure they put down everything they will close that week.
- Also, the numbers don't lie on the "3PPO." If you have 35 percent of your business booked for November on the 8th of October, it will be tough to hit budget. Yet, with this information now, you can be proactive in how you drive the sales force as you would be pacing behind by 20 percent for November. What would you do: Come up with a new up-sell package for current clients? Relax the rates and take share? Produce more specs weekly? Likewise, if you were pacing 20 percent ahead of where you should be, would you raise rates because of demand on inventory? This might be a good time to start staffing for the future and have the
bench player on the sales force now.
This whole process of calculating your projections weekly should take you no more than 10 minutes, once you get your figures from the sales reps. At this point, the critical factor is whether you are ahead of the curve or behind it. With that information, you can develop specific tactics to make up dollars - or blow way over budget!
Related Categories> Publications > Radio Ink

